AS Level 9618 · Paper 1 · 1.2
Multimedia
How images and sound are stored as data, and what changes their size and quality. Read the notes, try the past-paper questions, then check the mark scheme.
Past papers from June 2021 to June 202630 questions · 142 marks
In this subtopic
- How a bitmap image is encoded, and working out its file size
- What changing the resolution or colour depth does
- How a vector graphic is encoded, and when to use bitmap or vector
- How sound is sampled, and what the sampling rate and resolution change
1.2 · 1 of 17Book pages Contents
Bitmap images and pixels
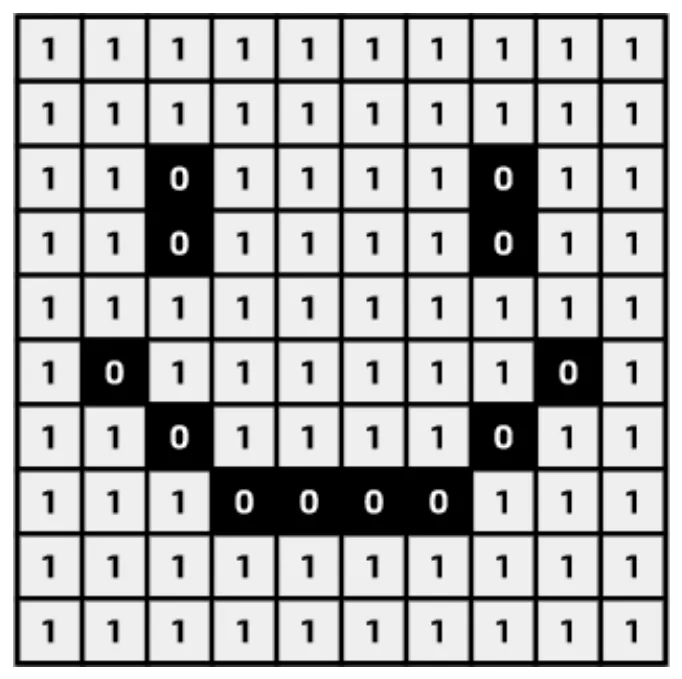
A bitmapped graphic (also called a bitmap image) is made up of a grid of pixels. A pixel (short for "picture element") is the smallest element in an image, and it is one single colour. If you magnify a bitmap image, you can see that it is made up of these tiny squares.
All data in a computer is stored as 1s and 0s, so each colour is given its own binary code. This black-and-grey image needs only two colours, so it can be stored using just one bit per pixel: a 0 for each black pixel and a 1 for each grey pixel.
In a photo taken with a digital camera, each pixel stores the colour that was detected by one part of the camera’s sensor.
Any image that needs only two colours can be stored with one bit per pixel. This image has been made by giving a 0 to each orange pixel and a 1 to each pink pixel:
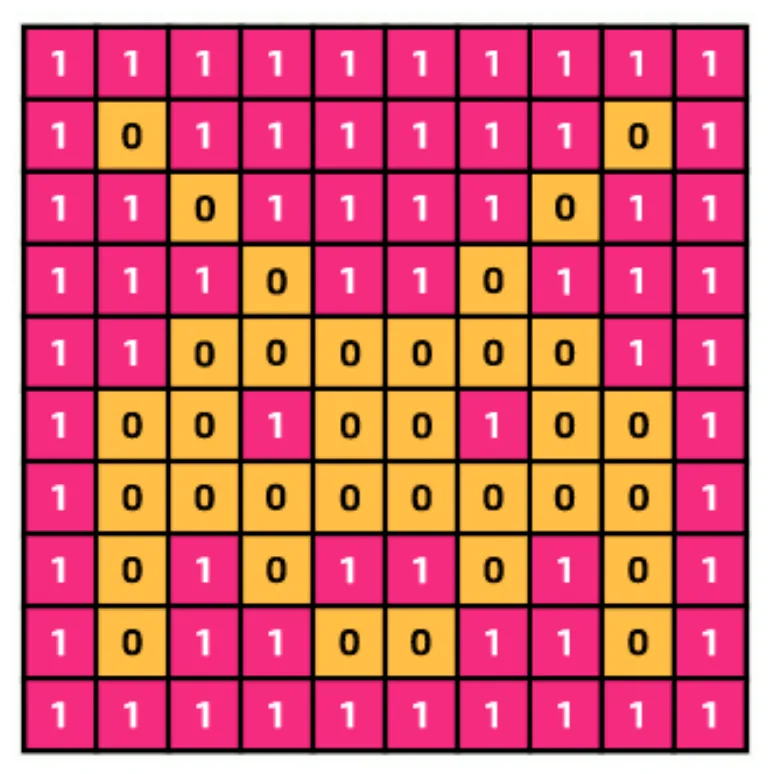
| Binary | Colour |
|---|---|
| 0 | Orange |
| 1 | Pink |
How the data for a bitmap image is encoded
- The image is made of pixels, and each pixel is one colour.
- Each colour has its own unique binary code.
- The binary code for the colour of each pixel is stored in sequence, pixel by pixel.
Practise this: past-paper questions
- June 2021 · Paper 11 · Q1(a)(i)Complete the following table to describe the two terms about graphics. | Term | Description | | Pixel | | | File header | |
- June 2022 · Paper 12 · Q1(a)Draw one line from each image representation term to its correct definition. Term: Pixel Bit depth Image resolution File header Definition: The…
- June 2023 · Paper 11 · Q1(a)Complete the table by defining the image terms. | Term | Definition | | Drawing list | | | Pixel | | | Colour depth | |
- June 2024 · Paper 12 · Q2(d)(i)Describe how the data for a bitmapped image is encoded
Show 4 more
- June 2025 · Paper 11 · Q3(a)One of the images is a bitmapped image. Complete the table by writing the answer for each statement. Statement | Answer the term for the smallest…
- June 2026 · Paper 11 · Q5(a)Explain how a bitmap image is encoded in a computer
- June 2026 · Paper 12 · Q1(a)Tick (✓) one box to identify the correct definition of a pixel in a bitmap image. a colour in an image a row of consecutive identical colours in…
- June 2026 · Paper 13 · Q3(b)(i)Explain how the data for the bitmapped images are encoded
Used later in
1.2 · 2 of 17Book pages Contents
Colour depth
Builds on
If an image needs more than two colours, it needs more bits per pixel. With 2 bits there are 2 × 2 = 4 different bit patterns, so four different colours can be shown. Each bit pattern is given a colour:
| Binary | Colour |
|---|---|
| 00 | Black |
| 01 | White |
| 10 | Blue |
| 11 | Red |
Using 3 bits gives more colours, because there are more bit patterns: 2 × 2 × 2 = 8 colours, as in this image.

The number of bits used for each pixel is called the colour depth (or bit depth). Instead of writing 2 × 2 × 2 = 8 colours, you can use a power: 23 = 8 colours. So with n bits per pixel, 2n different colours can be shown.
| Bits per pixel | Number of colours |
|---|---|
| 1 | 21 = 2 |
| 2 | 22 = 4 |
| 3 | 23 = 8 |
| 4 | 24 = 16 |
| 8 | 28 = 256 |
| 24 | 224 = 16 777 216 (about 16.7 million) |
The greater the colour depth, the more colours are available for the image. To find the smallest colour depth for an image, count its colours and find the smallest power of 2 that is at least that number. For example, an image with five colours needs 3 bits, because 22 = 4 is too few and 23 = 8 is enough.
Practise this: past-paper questions
- June 2022 · Paper 12 · Q1(a)Draw one line from each image representation term to its correct definition. Term: Pixel Bit depth Image resolution File header Definition: The…
- June 2022 · Paper 12 · Q1(b)(i)Identify the smallest number of bits that can be used to represent each colour in the complete bitmap image
- November 2022 · Paper 13 · Q2(e)The photographs are stored as bitmap images. Complete the statements about bitmap images by writing the missing words. The of a bitmap image is…
- June 2023 · Paper 11 · Q1(a)Complete the table by defining the image terms. | Term | Definition | | Drawing list | | | Pixel | | | Colour depth | |
Show 5 more
- November 2023 · Paper 11 · Q1(b)State what is meant by the bit depth of a bitmap image and explain how changing the bit depth affects the image. Definition ... Explanation
- November 2024 · Paper 12 · Q7(a)(i)Define the following bitmap terms. Colour depth File header
- November 2024 · Paper 13 · Q6(b)(i)State the largest number of different colours that can be represented by 8 bits
- June 2025 · Paper 11 · Q3(a)One of the images is a bitmapped image. Complete the table by writing the answer for each statement. Statement | Answer the term for the smallest…
- June 2026 · Paper 12 · Q1(d)(i)Identify the smallest bit depth that can be used for the image shown
Used later in
1.2 · 3 of 17Book pages Contents
Image resolution
Image resolution is about how clear an image is on a screen or on paper. When you zoom in to a bitmap image, its pixels are stretched into larger blocks. That is why a bitmap image looks poor when it is enlarged too much. In the pictures below, A has the most pixels and E has the fewest.
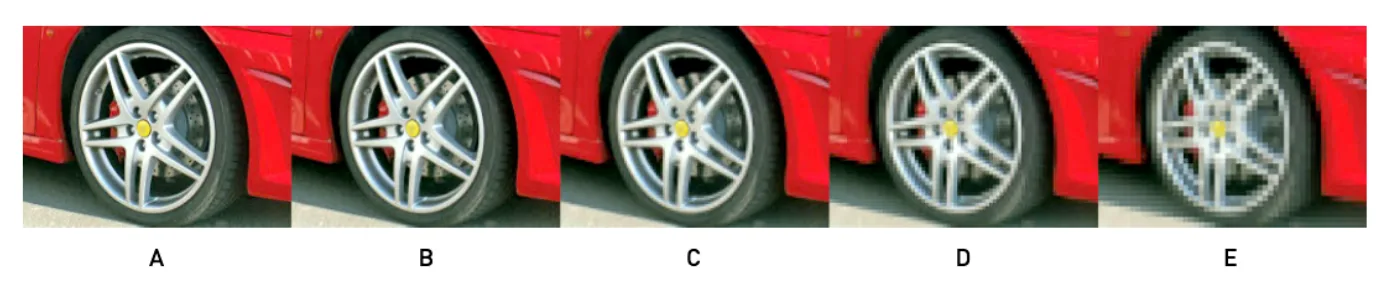
Image resolution can be given as the number of pixels the image has per inch, for example 300 ppi (pixels per inch). In this course, image resolution usually means the size of a bitmap image in pixels: the number of pixels wide by the number of pixels high, for example 1920 × 1080. The total number of pixels is the width (in pixels) multiplied by the height (in pixels).
Practise this: past-paper questions
1.2 · 4 of 17Book page Contents
Screen resolution
Image resolution should not be confused with screen resolution (or display resolution). Screen resolution is the number of pixels that a screen is set to display, given as the width of the screen in pixels by its height in pixels, for example 1920 × 1080. Screens with a large number of pixels (1280 × 720 and above) are called "high definition", because they show images and video more clearly.
If you view an image with a low resolution (for example 300 × 240 pixels) full screen on a screen with a higher resolution (for example 1280 × 720 pixels), the computer has to rescale the image to fit the screen, and the image looks pixelated.
Image resolution compared with screen resolution
- Image resolution is the number of pixels wide by the number of pixels high that make up the image.
- Screen resolution is the number of pixels wide by the number of pixels high that a screen can display.
- If the screen resolution is lower than the image resolution, the image is shown with less detail. Image resolution can be changed, but a screen has a fixed physical limit.
- Changing the screen resolution does not change the size of the image file.
Note One mark scheme has also accepted "screen resolution" as the term for the dots per inch (dpi) when an image is displayed.
Practise this: past-paper questions
- November 2022 · Paper 12 · Q8(a)Tick (✓) one box in each row to identify the effect of each action on the image file size. | Action | Increases the file size | Decreases the file…
- June 2025 · Paper 11 · Q3(a)One of the images is a bitmapped image. Complete the table by writing the answer for each statement. Statement | Answer the term for the smallest…
- June 2026 · Paper 12 · Q1(b)Describe the difference between the terms image resolution and screen resolution
1.2 · 5 of 17Book pages Contents
Calculating the file size of a bitmap image
Builds on
To estimate the size of an image file, multiply the number of pixels by the colour depth:
file size in bits =
   width × height × colour depth
Here the width and height are in pixels and the colour depth is in bits per pixel.
So the file gets bigger if either the colour depth or the image resolution goes up.
Worked example
An image is 8 pixels wide and 8 pixels high, with a colour depth of 4 bits. Calculate its size.
- Step 1Calculate the total number of bits: 8 × 8 × 4 = 256 bits.
As the number of bits grows, it makes sense to use bigger units: 1 byte (B) = 8 bits (b), 1 kilobyte (kB) = 1 000 bytes and 1 megabyte (MB) = 1 000 kilobytes.
Worked example
An image is 240 pixels wide and 300 pixels high, with a colour depth of 4 bits. Calculate its size in kilobytes.
- Step 1Calculate the total number of bits: 240 × 300 × 4 = 288 000 bits.
- Step 2Change bits into bytes: 288 000 / 8 = 36 000 bytes.
- Step 3Change bytes into kilobytes: 36 000 / 1 000 = 36 kB.
Worked example
An image is 1920 pixels wide and 1080 pixels high, with a colour depth of 24 bits. Calculate its size in megabytes.
- Step 1Calculate the total number of bits: 1920 × 1080 × 24 = 49 766 400 bits.
- Step 2Change bits into bytes: 49 766 400 / 8 = 6 220 800 bytes.
- Step 3Change bytes into kilobytes: 6 220 800 / 1 000 = 6220.8 kB.
- Step 4Change kilobytes into megabytes: 6220.8 / 1 000 = 6.2208 MB, about 6.2 MB.
Exam questions often ask for the answer in kibibytes (KiB) or mebibytes (MiB) instead. Then divide by 1024 at each step instead of 1 000: 1 KiB = 1024 bytes and 1 MiB = 1024 KiB.
Worked example (binary units)
A bitmap image is 2048 pixels wide and 1536 pixels high, with a colour depth of 24 bits. Estimate its file size in mebibytes.
- Step 1Calculate the total number of bits: 2048 × 1536 × 24 = 75 497 472 bits.
- Step 2Change bits into bytes: 75 497 472 / 8 = 9 437 184 bytes.
- Step 3Change bytes into kibibytes: 9 437 184 / 1024 = 9216 KiB.
- Step 4Change kibibytes into mebibytes: 9216 / 1024 = 9 MiB.
Note This only estimates the size. The real file is a little bigger, because it also stores the file header.
Practise this: past-paper questions
- June 2021 · Paper 11 · Q1(a)(ii)The image is scanned with an image resolution of 1024 × 512 pixels, and a colour depth of 8 bits per pixel. Calculate an estimate for the file…
- June 2022 · Paper 12 · Q1(b)(ii)Calculate an estimate for the file size of the section of the bitmap image shown, giving your answer in bytes. Use your answer from part (b)(i).…
- June 2023 · Paper 11 · Q1(b)(ii)One of the photographs has a bit depth of 8 bytes and an image resolution of 1500 pixels wide and 3000 pixels high. Calculate the file size of the…
- November 2023 · Paper 12 · Q6(c)A bitmap image has a resolution of 2048 pixels wide and 1024 pixels high. The image has a bit depth of 10 bits per pixel. Estimate the file size…
Show 7 more
- November 2023 · Paper 13 · Q2(b)Calculate the file size of a bitmap image using the following information: • image resolution of 2048 pixels wide and 1024 pixels high • bit depth…
- June 2024 · Paper 13 · Q2(a)The photograph has a resolution of 4000 pixels wide by 3000 pixels high. The bit depth is 4 bytes. Calculate an estimate for the file size of the…
- June 2025 · Paper 13 · Q1(a)(i)Calculate the file size of the image created by the digital camera in megabytes (MB). Show your working
- November 2025 · Paper 11 · Q7(d)(i)Calculate an estimate of the file size of the bitmap in kibibytes. Show your working
- November 2025 · Paper 12 · Q6(d)A bitmap image has a resolution of 1000 pixels wide by 2000 pixels high. The colour depth is 16 bits. Calculate an estimate of the file size in…
- November 2025 · Paper 13 · Q7(b)A video is made of many bitmap images called frames. 30 frames are recorded every second. Each frame is 4000 pixels wide by 3000 pixels high. The…
- June 2026 · Paper 13 · Q3(b)(ii)The bitmap images have a bit depth of 2 bytes. Each image is 2048 pixels wide by 1536 pixels high. One second of video contains eight individual…
Used later in
1.2 · 6 of 17Book pages Contents
Effects of changing resolution and colour depth
Builds on
The picture on the left has a colour depth of 24 bits and the one on the right has a colour depth of 8 bits. Which one looks worse?
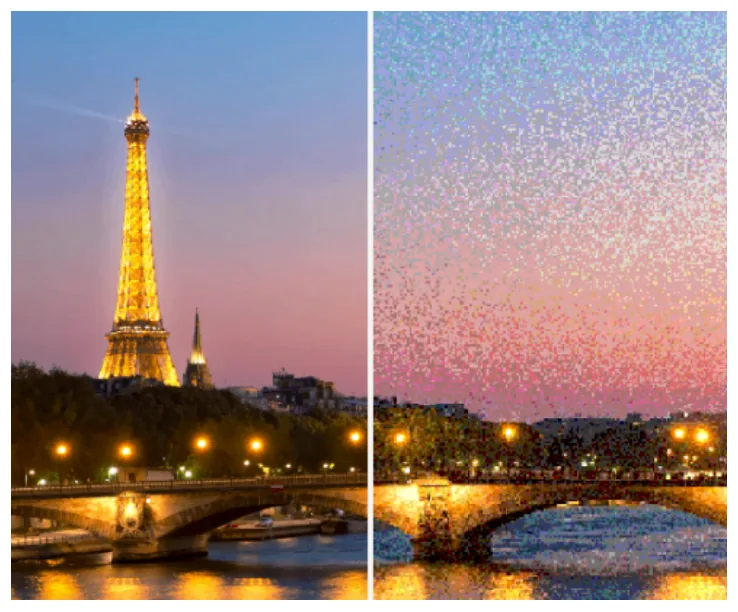
The 8-bit image can only show 256 different colours, but the 24-bit image can show about 16.7 million. Humans can see far more than 256 colours, so the 8-bit image looks poorer.
The file size of an image depends on its colour depth. These four copies of the same picture show how much the file size grows as the colour depth goes up:
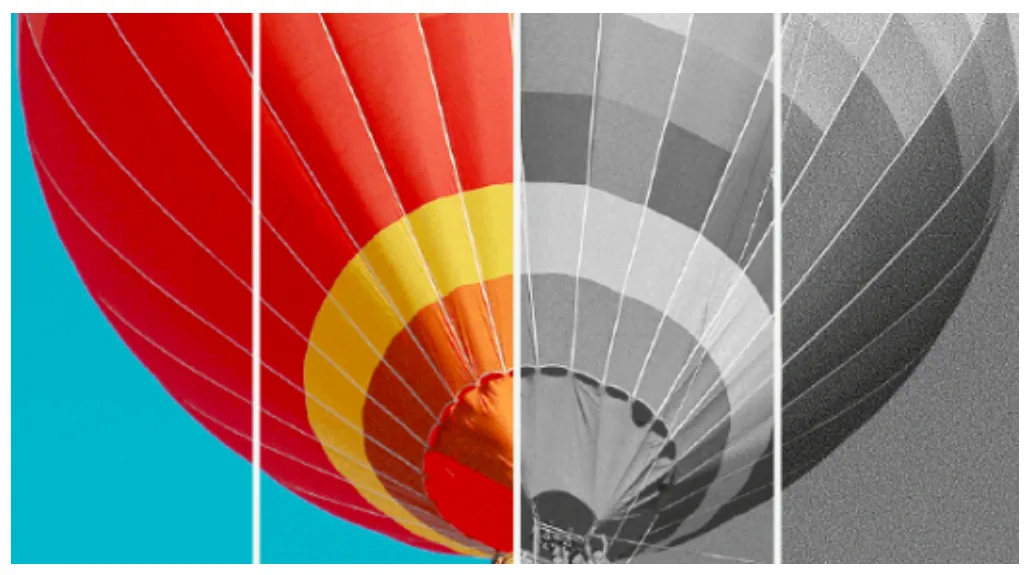
| Colour depth | Colours | File size |
|---|---|---|
| 24-bit colour | about 16.7 million | about 70 KB |
| 8-bit colour | 256 | 23.4 KB |
| 8-bit greyscale | 256 shades of grey | 23.4 KB |
| 1-bit black and white | 2 | 2.9 KB |
Colour depth and image quality. In real life we can see a huge range of colours, so the more colours a bitmap image uses, the closer it looks to reality. But not every image needs a high colour depth. Some images are not meant to look like real life, and even for real-life images a lower colour depth is not always noticeable. Finding a suitable colour depth is often a matter of trial and error.
Colour depth and file size. The main reason for reducing the colour depth is to make the file smaller. The more bits used for each colour, the more storage space the image needs. Smaller image files download more quickly on a web page and take less time to send by email.
Effects of changing a bitmap image
- Higher image resolution: more pixels, so the image is more detailed, sharper and less pixelated, but the file is bigger because more pixels are stored.
- Lower image resolution: fewer pixels, so detail is lost, but the file is smaller.
- Higher colour depth: more bits per pixel, so a greater range of colours and a more realistic image, but a bigger file.
- Lower colour depth: fewer bits per pixel, so fewer colours, the image is less like the original, but the file is smaller.
- Changing the colour of a shape, or the screen resolution, does not change the file size.
Practise this: past-paper questions
- June 2022 · Paper 12 · Q1(c)Describe how changing the colour depth of an image affects its file size
- November 2022 · Paper 12 · Q8(a)Tick (✓) one box in each row to identify the effect of each action on the image file size. | Action | Increases the file size | Decreases the file…
- November 2023 · Paper 11 · Q1(b)State what is meant by the bit depth of a bitmap image and explain how changing the bit depth affects the image. Definition ... Explanation
- November 2023 · Paper 13 · Q2(a)Describe the impact of increasing the image resolution on the quality of a bitmap graphic
Show 4 more
- June 2024 · Paper 13 · Q2(c)Identify two elements of a bitmap image that can be changed to reduce its file size
- November 2024 · Paper 12 · Q7(a)(ii)Explain why changing the image resolution will affect the image quality and file size. Image quality File size
- November 2024 · Paper 13 · Q6(b)(ii)State one drawback of increasing the number of bits that represents each pixel in the bitmap image
- June 2025 · Paper 13 · Q1(a)(ii)The student takes a second photograph with a lower bit depth. Explain the effect of decreasing the bit depth on the image and on the image file
1.2 · 7 of 17Book page Contents
Metadata and the file header
The real size of an uncompressed bitmap file is always greater than the simple file size calculation. As well as the pixel data, the file must store extra information so that the image can be shown correctly. This extra data is called metadata, which means data about data. Examples of metadata are:
- the image dimensions (width and height in pixels)
- the colour depth
- the file format (file type)
- the type of compression used
- the date and time it was created
- where it was created
- details of the device that created it
- camera settings
The metadata must be in a fixed position in the image file, so that any software that displays or uses the image can find and read it. It is usually at the start of the file, in an area called the file header.
One way to organise image metadata is the Exif (exchangeable image file format) standard, which has a wide range of metadata tags, such as detailed camera settings and the time and date.
File header
- Stores data about the image file (metadata), for example the file type, file size, image dimensions, colour depth and compression type.
- It is why the actual file size is larger than the estimate from width × height × colour depth.
Practise this: past-paper questions
- June 2021 · Paper 11 · Q1(a)(i)Complete the following table to describe the two terms about graphics. | Term | Description | | Pixel | | | File header | |
- June 2022 · Paper 12 · Q1(a)Draw one line from each image representation term to its correct definition. Term: Pixel Bit depth Image resolution File header Definition: The…
- November 2022 · Paper 13 · Q2(e)The photographs are stored as bitmap images. Complete the statements about bitmap images by writing the missing words. The of a bitmap image is…
- June 2023 · Paper 11 · Q1(b)(i)Colour depth and image resolution are both included in the file header of a bitmap image. Identify two other items that could be included in the…
Show 3 more
- November 2024 · Paper 12 · Q7(a)(i)Define the following bitmap terms. Colour depth File header
- November 2025 · Paper 11 · Q7(d)(ii)Explain why the actual file size may be larger than the one calculated in (d)(i)
- June 2026 · Paper 12 · Q1(c)Two items in a bitmap image file header are the resolution and colour depth. Identify one other item included in the file header of a bitmap image
Used later in
1.2 · 8 of 17Book pages Contents
Bitmap file formats and how bitmaps are made
Common file formats for bitmap images are:
- Bitmap: the file extension is .bmp
- PNG (Portable Network Graphic): the file extension is .png
- JPEG (Joint Photographic Experts Group): the file extension is .jpg or .jpeg
- GIF (Graphics Interchange Format): the file extension is .gif
Bitmap images are most often made by taking a photo with a digital camera or a phone camera. The image is stored as a grid of pixels, where each pixel is a digital record of a colour captured by the camera’s sensors. Most flatbed scanners also save the scanned image as a bitmap.
You can also make a bitmap yourself with bitmap editing software. This is slow for anything but the simplest images, but it is useful for small pictures such as the sprites in a computer game.
1.2 · 9 of 17Book pages Contents
Vector graphics
A vector graphic is an image made up of a list of drawing objects and their properties. A drawing object is a shape defined mathematically or geometrically, such as a rectangle, a line, a polygon or a circle. Each object has properties that set its:
- dimensions, for example its width and height
- appearance, for example its line colour, fill colour and line thickness
- position, for example its x and y coordinates
The objects and their properties are stored in a list called the drawing list. When the image is shown, the computer works through the drawing list and draws each object.
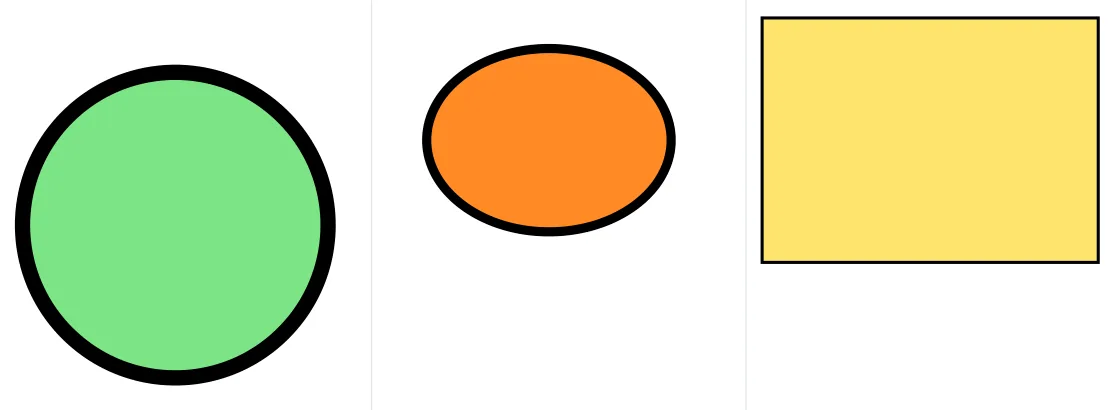
A common file format for vector graphics is SVG (Scalable Vector Graphics), which is used for vector graphics on the web. All popular web browsers can display SVG images. Here are the drawing lists for three simple vector graphics, written in SVG:
<circle cx="100" cy="100" r="50"
  fill="lightgreen" stroke="black"
  stroke-width="5" />

<ellipse cx="80" cy="60"
  rx="70" ry="50"
  fill="orange" stroke="black"
  stroke-width="3" />

<rect x="10" y="10"
  width="140" height="100"
  fill="yellow" stroke="black"
stroke-width="1" />| Object | What its properties mean |
|---|---|
| Circle | cx and cy give the coordinates of the centre; r gives the radius. |
| Ellipse | cx and cy give the coordinates of the centre; rx and ry give the horizontal and vertical radii. |
| Rectangle | x and y give the position of the top left-hand corner; width and height give its size. |
| All three | fill is the fill colour, stroke is the line colour and stroke-width is the line thickness. |
Vector graphic terms
- Drawing object: one individual element of the image, such as a line, a square or a circle, created using a formula.
- Property: one attribute of a drawing object, such as its line colour, line width or fill colour.
- Drawing list: all the drawing objects in the image, with the commands (and properties) needed to draw each one.
Practise this: past-paper questions
- November 2021 · Paper 12 · Q5(a)Complete the table by writing a description of each vector graphic term and give an example for this logo. Term | Description | Example from logo…
- June 2023 · Paper 11 · Q1(a)Complete the table by defining the image terms. | Term | Definition | | Drawing list | | | Pixel | | | Colour depth | |
- November 2023 · Paper 11 · Q1(a)Draw one line from each vector graphic term to its most appropriate description. Term | Description drawing list | a component created using a…
- June 2024 · Paper 12 · Q2(d)(ii)Describe the contents of a vector graphic drawing list
Show 2 more
- November 2024 · Paper 12 · Q7(b)The student draws a picture on paper that is scanned into the computer and saved as a vector graphic. Define the vector graphic terms property and…
- June 2026 · Paper 11 · Q5(b)Complete the description of a vector graphic by writing the missing terms. A is an individual element of an image, for example: a line, a square.…
1.2 · 10 of 17Book pages Contents
Vector graphics compared with bitmap images
Builds on
Advantages of vector graphics
Vectors can be resized without distortion. Vector graphics are scalable: they can be made bigger or smaller without distorting the image, because the computer redraws each object at the new size from its properties. A bitmap image can look pixelated when its size changes, especially when it is enlarged: the computer has to stretch the existing pixels over a larger area, so the shapes look rough and blurry.
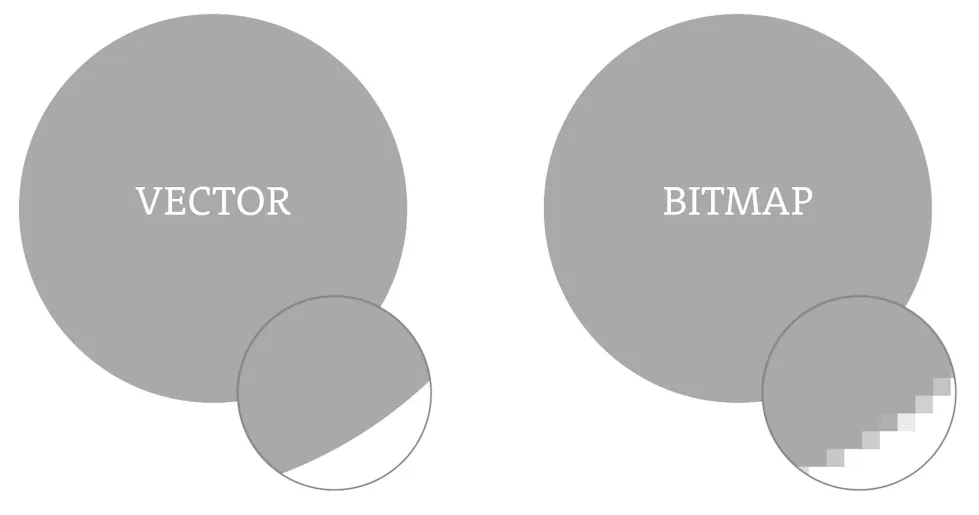
To resize a bitmap image without losing much quality, pixels have to be added to spread the colours over a larger area, so a bigger bitmap means a bigger file. Some photo editing programs can do this, but because a bitmap has no instructions for the exact shapes in the image, the result is less sharp than the original. A vector graphic can be scaled without any change to its file size: the size of a vector file only changes when objects are added or removed.
File size. Vector graphics usually have smaller files than bitmap images, especially when they do not have many detailed shapes. For example, the colour of an object in a vector graphic is stored once, as one property, but in an uncompressed bitmap image the colour has to be stored for every pixel, even if the whole shape is one colour.
Image editing. It is much simpler to create and edit vector graphics. Each object can be changed on its own by changing its properties, and objects can easily be added or removed. Changing a bitmap image often needs specialist photo editing software.
Resolution. Vector graphics stay good quality whatever the resolution of the screen or printer they are shown on. The quality of a bitmap image depends on its own image resolution and colour depth, so a low-resolution bitmap will not look good on a high-resolution screen or when it is printed.
Advantages of bitmap images
Vector graphics are built from a limited number of shapes, so the kinds of image they can show are limited. This is why they are mostly used for illustrations, cartoons, logos and web designs. Bitmap images can show almost any level of detail and complexity. Photographs are always stored as bitmaps.
Choosing a bitmap image or a vector graphic
- Choose a vector graphic for logos, diagrams, cartoons and other images made of simple shapes: it can be resized without pixelation, so it can be used at any size (on a letter or on a banner) without losing quality, each object can be edited separately, and the file is usually smaller.
- Choose a bitmap image for photographs and other detailed, realistic images: it can store any colour for every pixel, so it shows fine detail, shading and texture that shapes cannot.
Practise this: past-paper questions
- November 2021 · Paper 12 · Q5(b)(i)Describe two differences between a vector graphic and a bitmap image
- November 2022 · Paper 12 · Q8(b)State two benefits of creating a vector graphic instead of a bitmap image. 1 2
- June 2026 · Paper 11 · Q5(c)Tick (✓) one box to identify whether a bitmap image or a vector graphic will be most appropriate for the school logo. Justify your choice. | tick…
1.2 · 11 of 17Book page Contents
Sound waves and analogue data
Sound is caused by vibration. To make a sound, something has to vibrate, such as the string of a guitar, a person’s voice box or the loudspeaker of a radio. The vibrating particles knock into other particles, which vibrate and knock into more particles, and so on. This is how sound waves travel away from their source. We hear sounds because the vibrations in the air make our eardrums vibrate. In the same way, a microphone picks up vibrations in the air and turns them into electrical signals.
A sound wave is usually drawn as a graph that looks a bit like a water wave. This is not exactly how the particles move (they move backwards and forwards in the direction the wave travels), but it lets us show the sound wave on a graph.
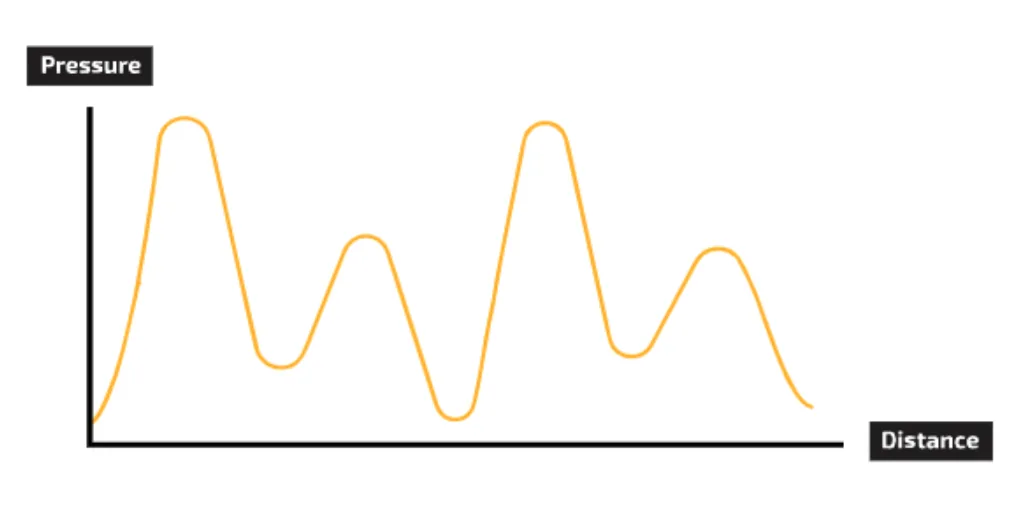
A sound wave is analogue. This means that the value on the graph (here, the air pressure as the sound passes) can be any value, not just certain fixed (discrete) values. Over time it changes smoothly, instead of jumping from one value to the next.
Analogue and digital data
- Analogue data changes continuously and can take any value in a range, such as a sound wave before it is recorded.
- Digital data can only take certain fixed (discrete) values. A computer stores it in binary.
- Sound must be changed from analogue to digital before a computer can store or process it.
Practise this: past-paper questions
Used later in
1.2 · 12 of 17Book pages Contents
Amplitude and frequency
A graph of a sound wave over time shows two features that change how the sound sounds to us: the amplitude and the frequency.
The amplitude is the height of the wave on the graph, from the middle to its highest point. It shows how loud the sound is: sound waves with a higher amplitude are louder. For example, an actor speaking to a whole theatre makes a sound wave with a higher amplitude than someone in the audience whispering to a friend.
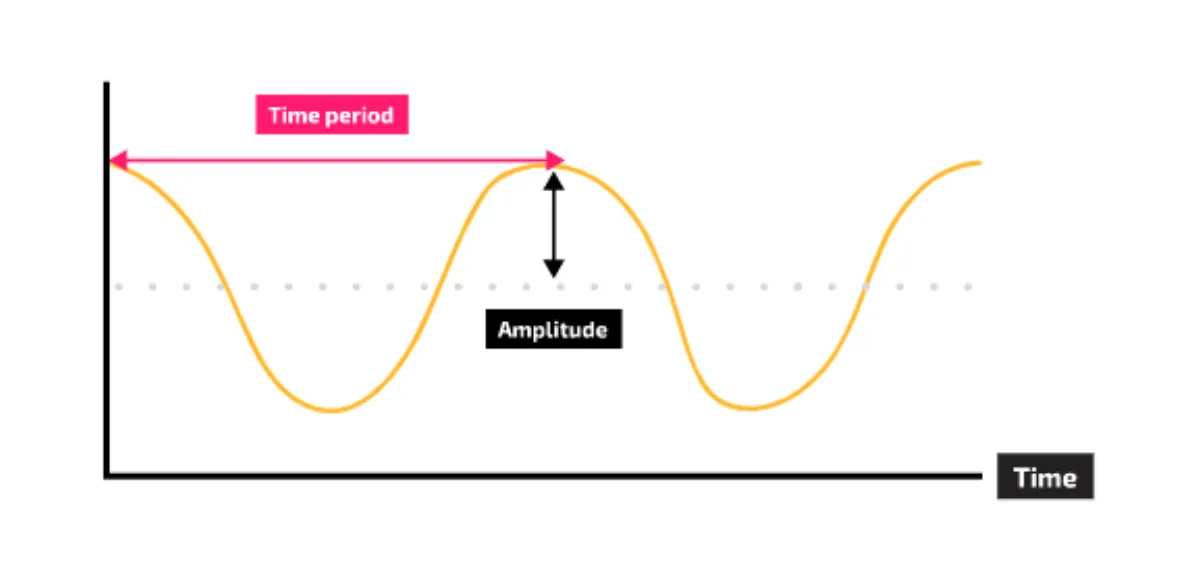
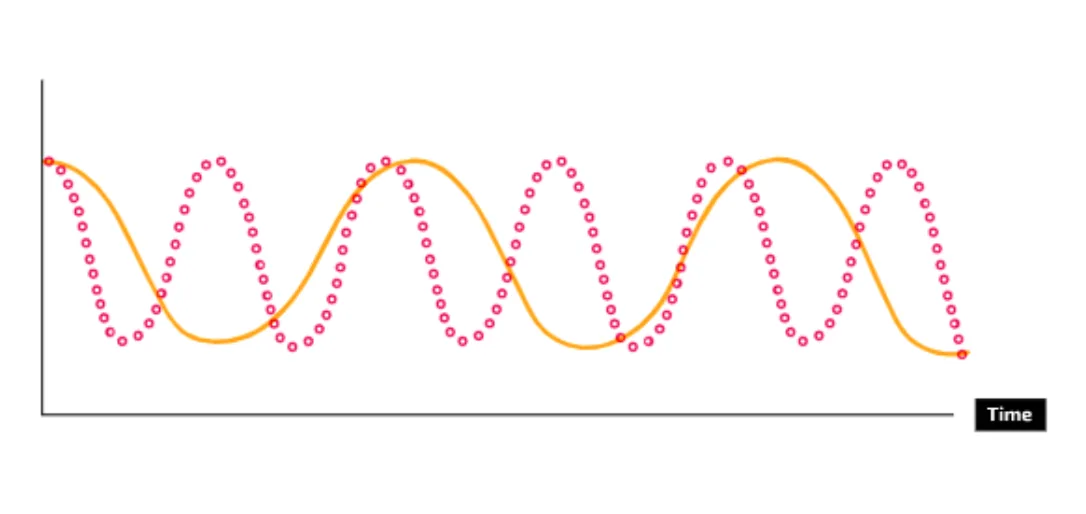
The time period of a sound wave is the time between two peaks of the wave. The frequency is 1 divided by the time period, and it is measured in hertz (Hz). The frequency shows the pitch of the sound: a higher frequency gives a higher pitch. For example, the graph of the shrill sound of a whistle is much more bunched up than the graph of the deep sound of a double bass. In the graph below, the sound shown by the pink dotted line has a higher pitch than the sound shown by the orange line.
1.2 · 13 of 17Book pages Contents
Sampling: turning sound into digital data
To make a digital sound file that can closely recreate the original sound, the computer has to change the analogue sound wave into a digital form. To record a sound:
- A microphone picks up the sound waves and turns them into analogue electrical signals.
- An analogue to digital converter (ADC) changes the electrical signals into digital values that can be stored on a computer. This process is called sampling: the level (amplitude) of the analogue signal is measured at regular time intervals. Each measurement is called a sample.
- Each sample is given a binary pattern and stored in the computer’s memory.
Once the sound is digital, it can be edited with sound processing software. To play a digital sound file, it has to be changed back into analogue sound waves:
- A digital to analogue converter (DAC) changes the digital values stored on the computer into analogue electrical signals.
- The signals are passed to a speaker. The speaker cone vibrates and moves the air, making analogue sound waves.
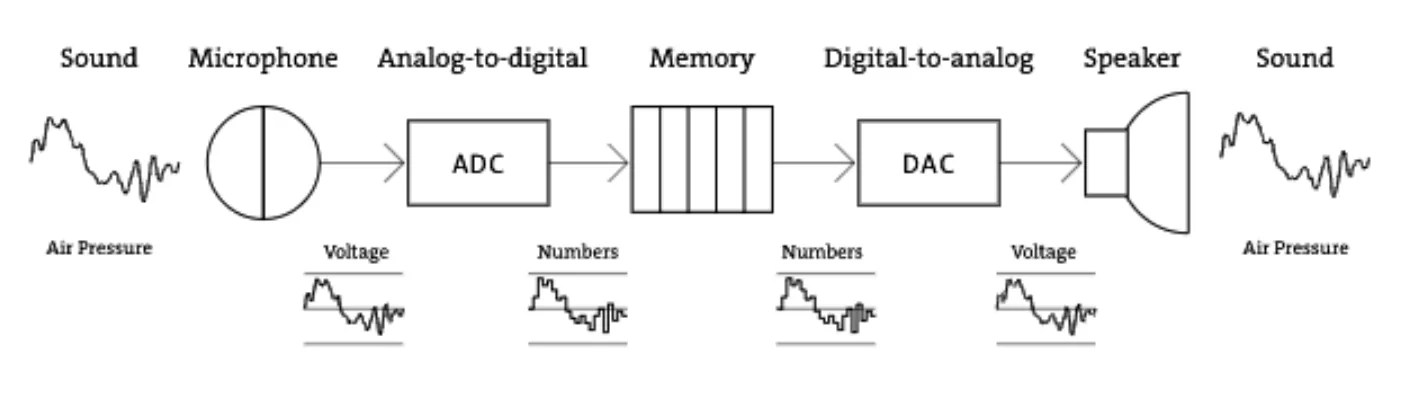
The sound waves that come out of the speaker may be quite different from the original sound waves. How close they are depends on the sampling rate and the sampling resolution.
How sound is represented in a computer
- The amplitude (height) of the analogue sound wave is measured at set time intervals, a set number of times each second. This is sampling.
- Each measurement (sample) is given a binary number.
- The binary numbers are stored in sequence.
Practise this: past-paper questions
- June 2023 · Paper 13 · Q3(c)(i)Describe how sound is represented in a computer
- November 2023 · Paper 13 · Q1(b)Draw one line from each term to its most appropriate description. Term | Description sampling | the number of samples taken per second sampling…
- November 2024 · Paper 13 · Q6(c)(i)Explain how an analogue sound wave is converted into digital data
Used later in
1.2 · 14 of 17Book pages Contents
Sampling rate
How often should the ADC sample the sound wave? If it takes samples only rarely, the digital sound will sound very different from the original. If it takes samples very often, the digital sound will be close to the original, but the file will be very large, because it stores a large number of samples.
The sampling rate is the number of samples taken per second. It is measured in hertz (one hertz is one sample per second). A sampling rate of 44.1 kHz means the sound wave is measured 44 100 times every second. The higher the sampling rate, the better the quality of the recording, and the bigger the file.
To rebuild the original sound accurately from its samples, a high sampling rate is needed. The graphs below show the same sound sampled at a high rate, at half that rate and at a third of that rate:
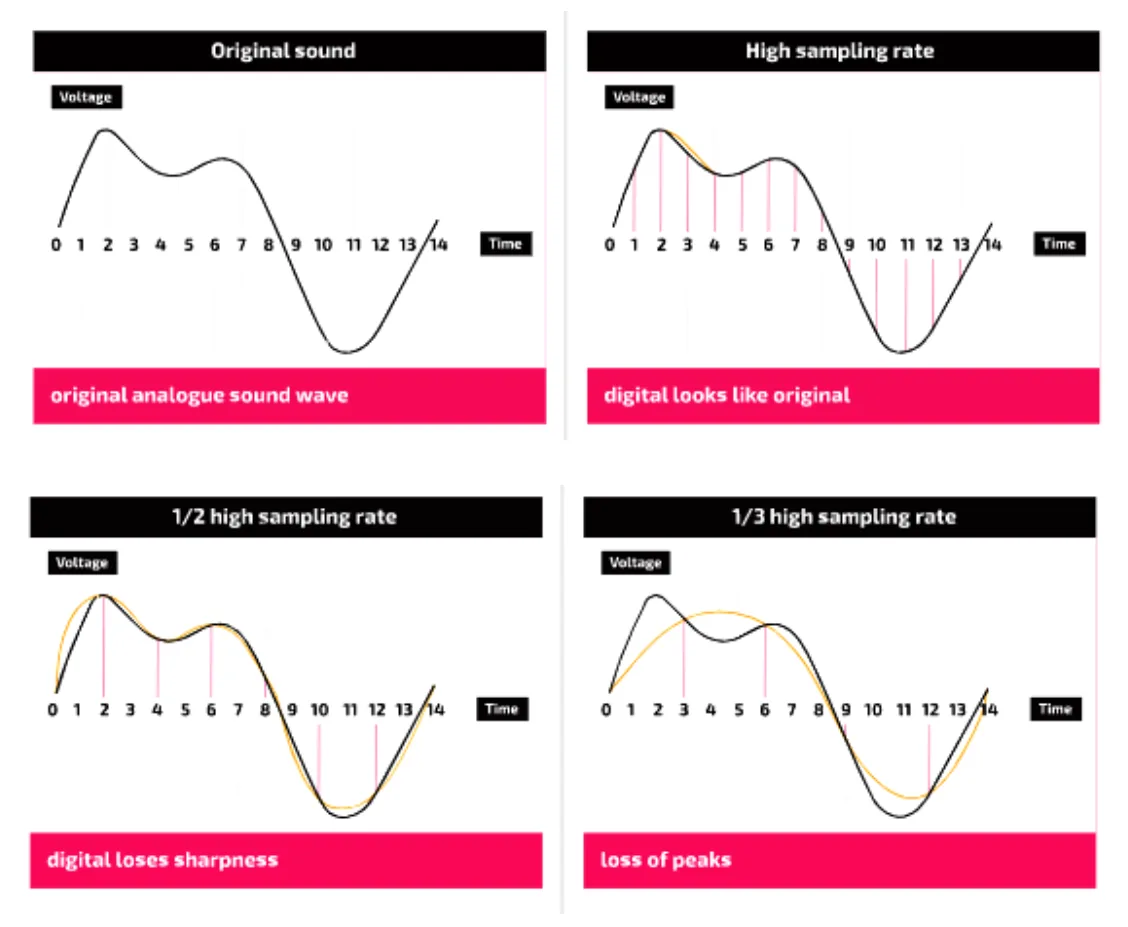
This graph shows a very low sampling rate of 1 sample per second. The sound recreated from the samples is very different from the original:
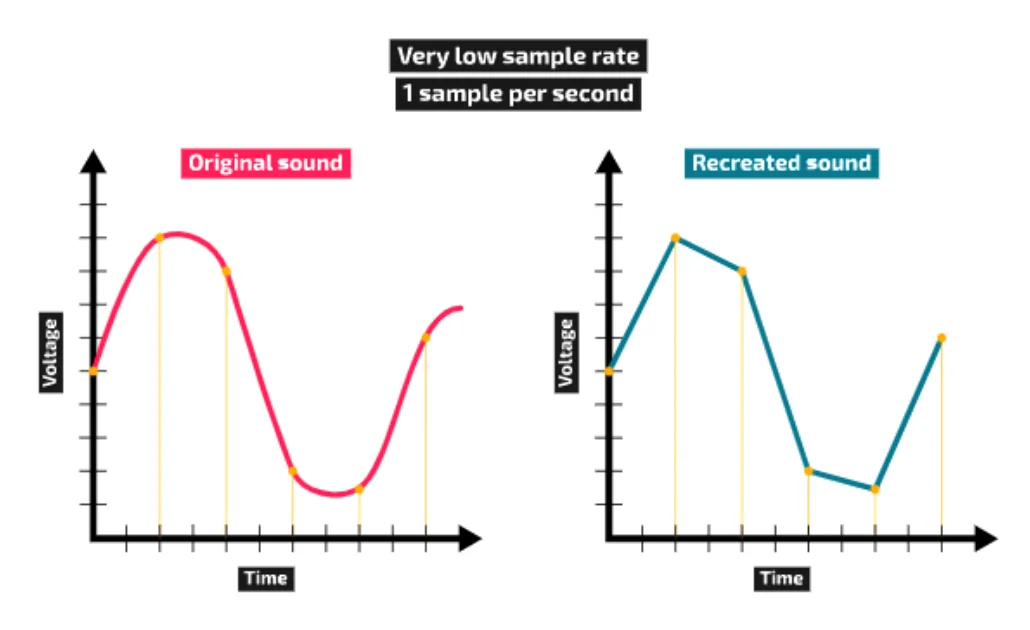
Raising the sampling rate makes the copy more accurate, because the gaps between samples are smaller. 44 100 Hz (44.1 kHz) is a common sampling rate for digital audio: the sound is sampled 44 100 times per second, and these samples are used to rebuild the sound when it is played back.
The Nyquist theorem. The human ear can hear frequencies from about 20 Hz up to about 20 kHz (at most about 22 000 Hz). The Nyquist theorem says that, to reproduce a recording accurately, the sampling rate must be at least double the highest frequency. So music for a CD is recorded with a sampling rate of 44 100 Hz. Recording only the human voice needs a lower sampling rate, around 8000 Hz.
Increasing the sampling rate
- Samples are taken more often, so the time gaps between samples are smaller.
- The digital sound wave is closer to the original analogue wave, so the recording is more accurate, with smaller quantisation errors.
- More samples are stored each second, so more bits are stored and the file is larger.
Practise this: past-paper questions
- November 2021 · Paper 11 · Q7(a)(i)Describe the reasons why the sound is closer to the original when a higher sample rate is used
- November 2021 · Paper 11 · Q7(a)(ii)Describe the reasons why the sound file size increases when a higher sample rate is used
- November 2022 · Paper 11 · Q1(d)(i)State what is meant by sampling rate
- November 2022 · Paper 12 · Q6(b)(i)Explain the effect of increasing the sampling rate on the accuracy of the sound recording
Show 5 more
- June 2023 · Paper 13 · Q3(c)(ii)A second video is recorded. The sound in the second video needs to be more precise. Explain the reasons why increasing the sampling rate and the…
- November 2023 · Paper 13 · Q1(b)Draw one line from each term to its most appropriate description. Term | Description sampling | the number of samples taken per second sampling…
- June 2024 · Paper 11 · Q2(d)The digital camera has a microphone which is used to record the sound for the video. The user changes the sampling rate that the microphone uses…
- June 2025 · Paper 13 · Q1(b)A teacher records an audio file of the student playing the piano during a music lesson. Complete the table by giving the term for each description…
- June 2026 · Paper 12 · Q4(a)Describe what is meant by a sampling rate of 44.1 kHz
1.2 · 15 of 17Book pages Contents
Sampling resolution
Each sample measures the level of the signal, which stands for the height of the sound wave at one moment. The sampling resolution (or sample resolution) is the number of bits used to store each sample. It sets how many different values a sample can take.
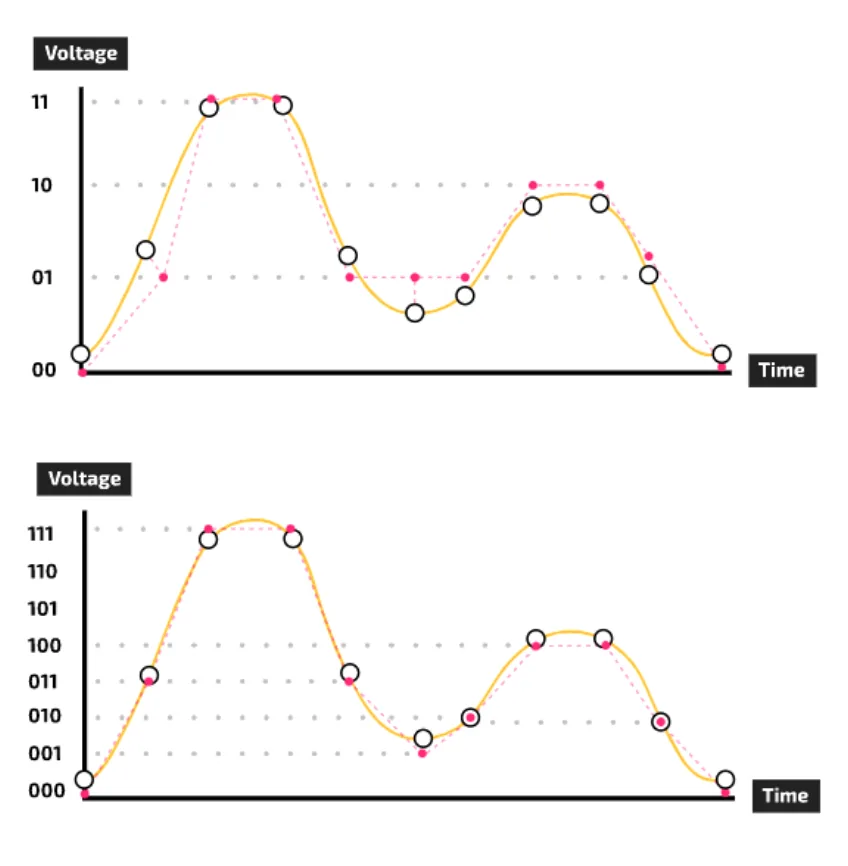
With a low sampling resolution (very few bits per sample) there are only a few binary patterns, so the changes in the analogue signal cannot be stored accurately. Each value has to be stored as the nearest digital value available. The difference between the real analogue value and the value stored is called the quantisation error. In the top graph below, with only 2 bits per sample, measurements at different levels have to be stored with the same binary pattern. With 3 bits per sample (bottom graph) each sample is stored more accurately.
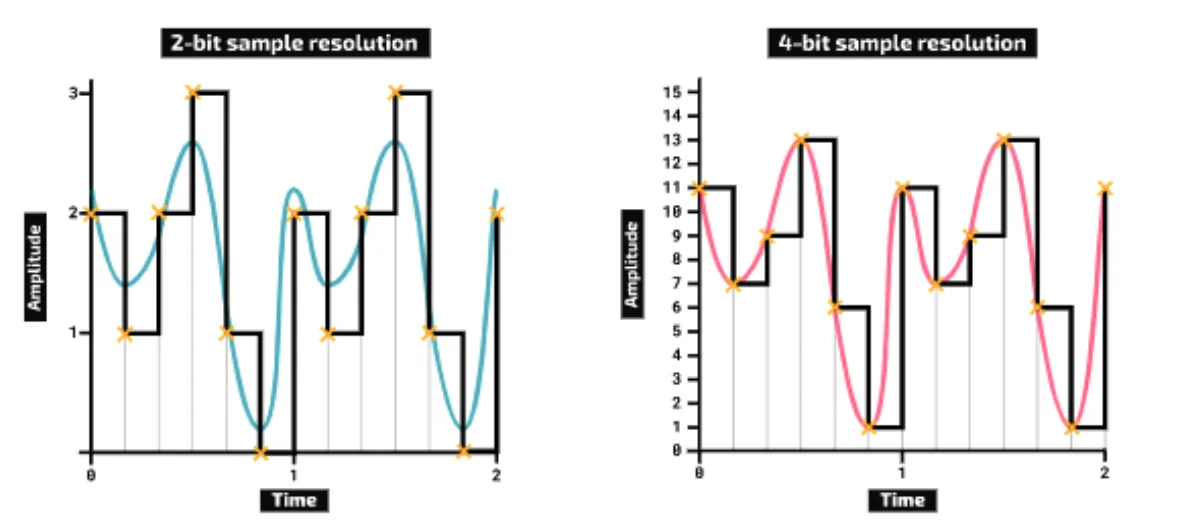
In this example, with 2 bits each sample can only be one of 4 levels (0 to 3), but with 4 bits there are 16 levels (0 to 15), so the stepped digital wave follows the real wave much more closely:
A high sampling resolution makes the file larger, so it takes up more storage space. This may not be practical, depending on what the recording is for. Digital audio usually uses one of two resolutions:
- 8-bit audio, when lower-quality sound is good enough, for example in devices that only need simple sounds.
- 16-bit audio, the standard for CDs and sound cards. With 16 bits per sample there are 216 = 65 536 possible values.
Increasing the sampling resolution
- More bits are used for each sample, so more different amplitudes can be stored.
- Each stored amplitude is closer to the real analogue amplitude, so quantisation errors are smaller and the digital sound is more accurate.
- Each sample takes more bits, so the file is larger.
- Decreasing the sampling resolution does the opposite: fewer bits per sample, a smaller file and a less accurate recording.
Practise this: past-paper questions
- November 2022 · Paper 11 · Q1(d)(ii)Explain the effect of increasing the sampling resolution on the sound file
- November 2022 · Paper 12 · Q6(b)(ii)Explain the effect of decreasing the sampling resolution on the file size of the sound recording
- June 2023 · Paper 13 · Q3(c)(ii)A second video is recorded. The sound in the second video needs to be more precise. Explain the reasons why increasing the sampling rate and the…
- November 2023 · Paper 12 · Q6(b)Explain the impact of changing the sampling resolution on the accuracy of a sound recording
Show 4 more
- November 2023 · Paper 13 · Q1(b)Draw one line from each term to its most appropriate description. Term | Description sampling | the number of samples taken per second sampling…
- June 2025 · Paper 13 · Q1(b)A teacher records an audio file of the student playing the piano during a music lesson. Complete the table by giving the term for each description…
- June 2026 · Paper 12 · Q4(b)A student creates a recording of a sound with a sampling resolution of 2 bytes. The student creates a second recording of the same sound but with…
- June 2026 · Paper 13 · Q3(a)The sound is recorded with a sampling resolution of 2 bytes. State what is meant by a sampling resolution of 2 bytes
1.2 · 16 of 17Book pages Contents
Calculating the size of a sound file
Builds on
To find how much storage a sound file needs, in bits:
- work out the number of samples: multiply the sampling rate in Hz (samples per second) by the length of the recording in seconds;
- work out the number of bits: multiply the number of samples by the sampling resolution (bits per sample).
storage in bits =
   sampling rate × seconds
   × sampling resolution
To give the answer in other units, divide by 8 to get bytes, then by 1 000 for kilobytes and again for megabytes (or by 1024 for kibibytes and mebibytes).
Mono and stereo. One more thing changes the file size: whether the sound is monophonic or stereophonic (mono or stereo). Mono sound is one track of sound. Stereo sound has two different tracks (channels), which give an impression of position and direction. Two tracks need twice the storage, so a stereo recording is twice the size of a mono recording with the same length, sampling rate and sampling resolution:
stereo storage in bits =
   sampling rate × seconds
   × sampling resolution × 2
Worked example
A stereo recording lasts 3 minutes. It has a sampling rate of 44.1 kHz and a sampling resolution of 16 bits. Calculate its size in megabytes.
- Step 1Change the length into seconds: 3 × 60 = 180 seconds.
- Step 2Calculate the bits for one track: 44 100 × 180 × 16 = 127 008 000 bits.
- Step 3There are two tracks: 127 008 000 × 2 = 254 016 000 bits.
- Step 4Change into bytes: 254 016 000 / 8 = 31 752 000 bytes, which is 31.752 MB, about 31.8 MB.
Practise this: past-paper questions
Used later in
1.2 · 17 of 17Book pages Contents
Changing the sampling rate and resolution
Builds on
When you record digital sound you often have to choose between accuracy and file size. Increasing either the sampling rate or the sampling resolution improves the quality of the sound, but makes the file larger. Decreasing either one makes the file smaller, but the sound quality is worse.
These examples start with a sound file in standard CD quality: a sampling rate of 44.1 kHz (44 100 Hz) and a sampling resolution of 16 bits.
Worked example
Calculate the size of a 3-minute (180-second) mono sound file recorded at 44.1 kHz with 16 bits per sample.
- Step 1Storage = 44 100 (hertz) × 180 (seconds) × 16 (bits) = 127 008 000 bits.
- Step 2Change into bytes: 127 008 000 / 8 = 15 876 000 bytes.
- Step 3Taking 1 kB as 1 000 bytes and 1 MB as 1 000 kB, the size is 15.876 MB, about 15.9 MB.
Increasing the sampling rate. 44.1 kHz is the standard rate for CDs and MP3s, but the most common sampling rate for the sound in films and on DVDs is 48 kHz. Raising the rate from 44.1 kHz to 48 kHz gives 48 000 × 180 × 16 = 138 240 000 bits = 17 280 000 bytes = 17.28 MB. The file is about 1.4 MB, or 9%, bigger.
Decreasing the sampling rate. FM radio usually uses a sampling rate of 32 kHz, and some digital video uses it too, because it allows four channels of sound to be recorded. Lowering the rate from 44.1 kHz to 32 kHz gives 32 000 × 180 × 16 = 92 160 000 bits = 11 520 000 bytes = 11.52 MB. The file is about 4.4 MB, or 27%, smaller.
Increasing the sampling resolution. More bits per sample give a greater dynamic range (the range between the quietest and loudest sounds that can be stored). For example, Blu-ray discs, used for high-definition video, support a 24-bit sampling resolution. This gives 44 100 × 180 × 24 = 190 512 000 bits = 23 814 000 bytes, about 23.8 MB. The file is about 7.9 MB, or 50%, bigger.
Decreasing the sampling resolution. Some digital audio files use 12 bits per sample instead of 16. This gives 44 100 × 180 × 12 = 95 256 000 bits = 11 907 000 bytes, about 11.9 MB. The file is about 4.0 MB, or 25%, smaller.
| Settings (180 seconds, mono) | Size | Change from 15.9 MB |
|---|---|---|
| 44.1 kHz, 16 bits (CD quality) | 15.9 MB | none |
| 48 kHz, 16 bits | 17.3 MB | about 9% bigger |
| 32 kHz, 16 bits | 11.5 MB | about 27% smaller |
| 44.1 kHz, 24 bits | 23.8 MB | 50% bigger |
| 44.1 kHz, 12 bits | 11.9 MB | 25% smaller |
Effects of changes on a sound recording
- Increase the sampling rate: the file gets bigger and the recording is more accurate.
- Increase the sampling resolution: the file gets bigger and the recording is more accurate.
- Decrease either one: the file gets smaller and the recording is less accurate.
- Increase the length of the recording: the file gets bigger, but the accuracy does not change.
- A bigger file takes longer to send and fills storage faster.
Practise this: past-paper questions
- November 2022 · Paper 13 · Q1(a)Tick (✓) one box in each row to identify the effect of each action on the accuracy of the recording. | Action | Accuracy increases | Accuracy…
- June 2024 · Paper 11 · Q2(d)The digital camera has a microphone which is used to record the sound for the video. The user changes the sampling rate that the microphone uses…
- November 2025 · Paper 13 · Q1(a)Making changes to a sound recording may impact the accuracy of the resulting sound file or the size of the file. Draw two lines from each change…
1.2
Concepts in 1.2
Every idea explained in 1.2, and where else in the notes it is used.
Zain Merchant's notes, page by page, as printed in his book. The Notes tab has the same notes as text, with links.
Past-paper questions and mark schemes © Cambridge University Press & Assessment. Compiled for revision by Zain Merchant.
- June 2021 · Paper 11 · Q1Notes:Bitmap images and pixelsCalculating the file size of a bitmap imageMetadata and the file header
- November 2021 · Paper 11 · Q7Notes:Sampling rate
- November 2021 · Paper 12 · Q5Notes:Vector graphicsVector graphics compared with bitmap images
- June 2022 · Paper 12 · Q1Notes:Bitmap images and pixelsColour depthImage resolutionCalculating the file size of a bitmap imageEffects of changing resolution and colour depthMetadata and the file header
- November 2022 · Paper 11 · Q1Notes:Sampling rateSampling resolution
- November 2022 · Paper 12 · Q6Notes:Sampling rateSampling resolution
- November 2022 · Paper 12 · Q8Notes:Screen resolutionEffects of changing resolution and colour depthVector graphics compared with bitmap images
- November 2022 · Paper 13 · Q1Notes:Calculating the size of a sound fileChanging the sampling rate and resolution
- November 2022 · Paper 13 · Q2Notes:Colour depthMetadata and the file header
- June 2023 · Paper 11 · Q1Notes:Bitmap images and pixelsColour depthCalculating the file size of a bitmap imageMetadata and the file headerVector graphics
- June 2023 · Paper 13 · Q3Notes:Sampling: turning sound into digital dataSampling rateSampling resolution
- November 2023 · Paper 11 · Q1Notes:Colour depthEffects of changing resolution and colour depthVector graphics
- November 2023 · Paper 12 · Q6Notes:Calculating the file size of a bitmap imageSampling resolution
- November 2023 · Paper 13 · Q1Notes:Sound waves and analogue dataSampling: turning sound into digital dataSampling rateSampling resolution
- November 2023 · Paper 13 · Q2Notes:Calculating the file size of a bitmap imageEffects of changing resolution and colour depth
- June 2024 · Paper 11 · Q2Notes:Sampling rateChanging the sampling rate and resolution
- June 2024 · Paper 12 · Q2Notes:Bitmap images and pixelsVector graphics
- June 2024 · Paper 13 · Q2Notes:Calculating the file size of a bitmap imageEffects of changing resolution and colour depth
- November 2024 · Paper 12 · Q7Notes:Colour depthEffects of changing resolution and colour depthMetadata and the file headerVector graphics
- November 2024 · Paper 13 · Q6Notes:Colour depthEffects of changing resolution and colour depthSampling: turning sound into digital data
- June 2025 · Paper 11 · Q3Notes:Bitmap images and pixelsColour depthScreen resolution
- June 2025 · Paper 13 · Q1Notes:Calculating the file size of a bitmap imageEffects of changing resolution and colour depthSound waves and analogue dataSampling rateSampling resolution
- November 2025 · Paper 11 · Q7Notes:Calculating the file size of a bitmap imageMetadata and the file header
- November 2025 · Paper 12 · Q6Notes:Calculating the file size of a bitmap image
- November 2025 · Paper 13 · Q1Notes:Changing the sampling rate and resolution
- November 2025 · Paper 13 · Q7Notes:Calculating the file size of a bitmap image
- June 2026 · Paper 11 · Q5Notes:Bitmap images and pixelsVector graphicsVector graphics compared with bitmap images
- June 2026 · Paper 12 · Q1Notes:Bitmap images and pixelsColour depthImage resolutionScreen resolutionMetadata and the file header
- June 2026 · Paper 12 · Q4Notes:Sampling rateSampling resolution
- June 2026 · Paper 13 · Q3Notes:Bitmap images and pixelsCalculating the file size of a bitmap imageSampling resolution
Past-paper questions and mark schemes © Cambridge University Press & Assessment. Compiled for revision by Zain Merchant.
Try the questions first.
Write your answers, then check them against the mark scheme. Your choice is remembered on this device.